Additional data is available from the Dutch Open Telescope Database, hosted by Leiden University.
NOTE: In case some images are not visible, please refresh the webpage in the browser (e.g. F5 key).
2005
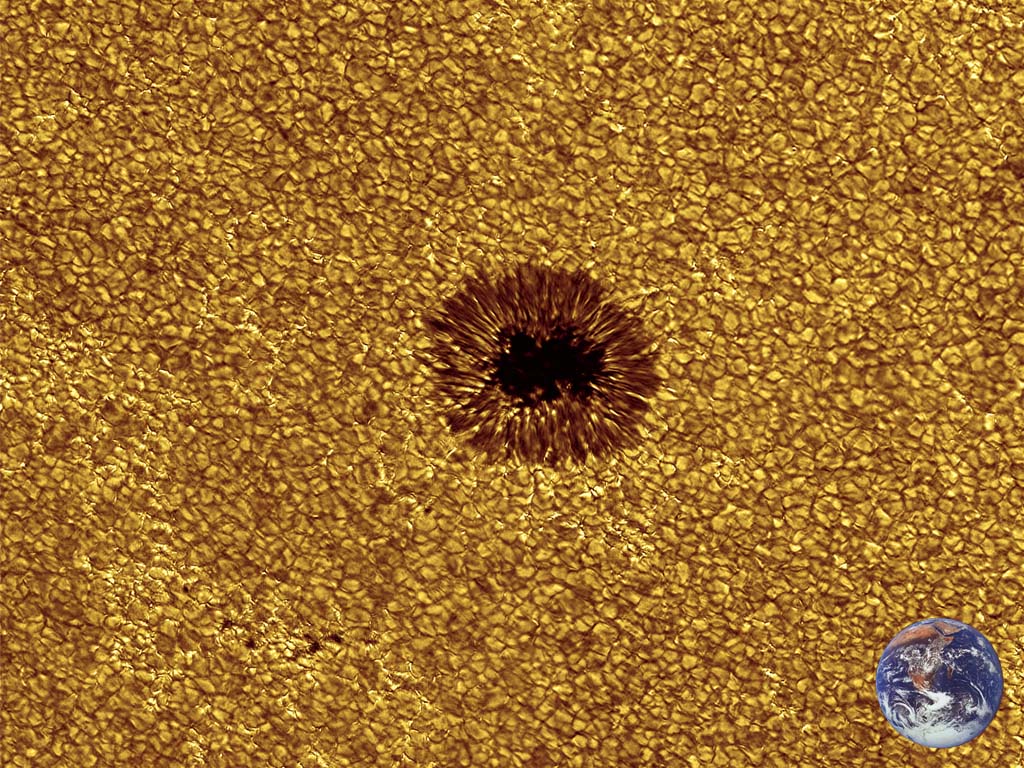
Solar active region AR10786 in a mosaic of 2 by 2 DOT images taken on July 8, 2005. The field measures 182 x 133 arcsec. The inserted Earth photograph indicates the scale. The sunspot umbrae remain dark in H-alpha. Many so-called fibrils emanate away from the sunspots. They outline magnetic connections between different areas, like iron filings around a bar magnet. The many fibrils show how complex solar magnetism is arranged within the solar atmosphere. The whitish areas surrounding the sunspots are known as plage, where clusters of magnetic elements are concentrated. The long slender dark structures are active region filaments. They end in bipolar regions where both positive and negative magnetic fields emerge through the solar surface. The coloring is artificial.

Images in the G band (left) and the Ca II H line (right) of active region AR10786 on July 8, 2005.

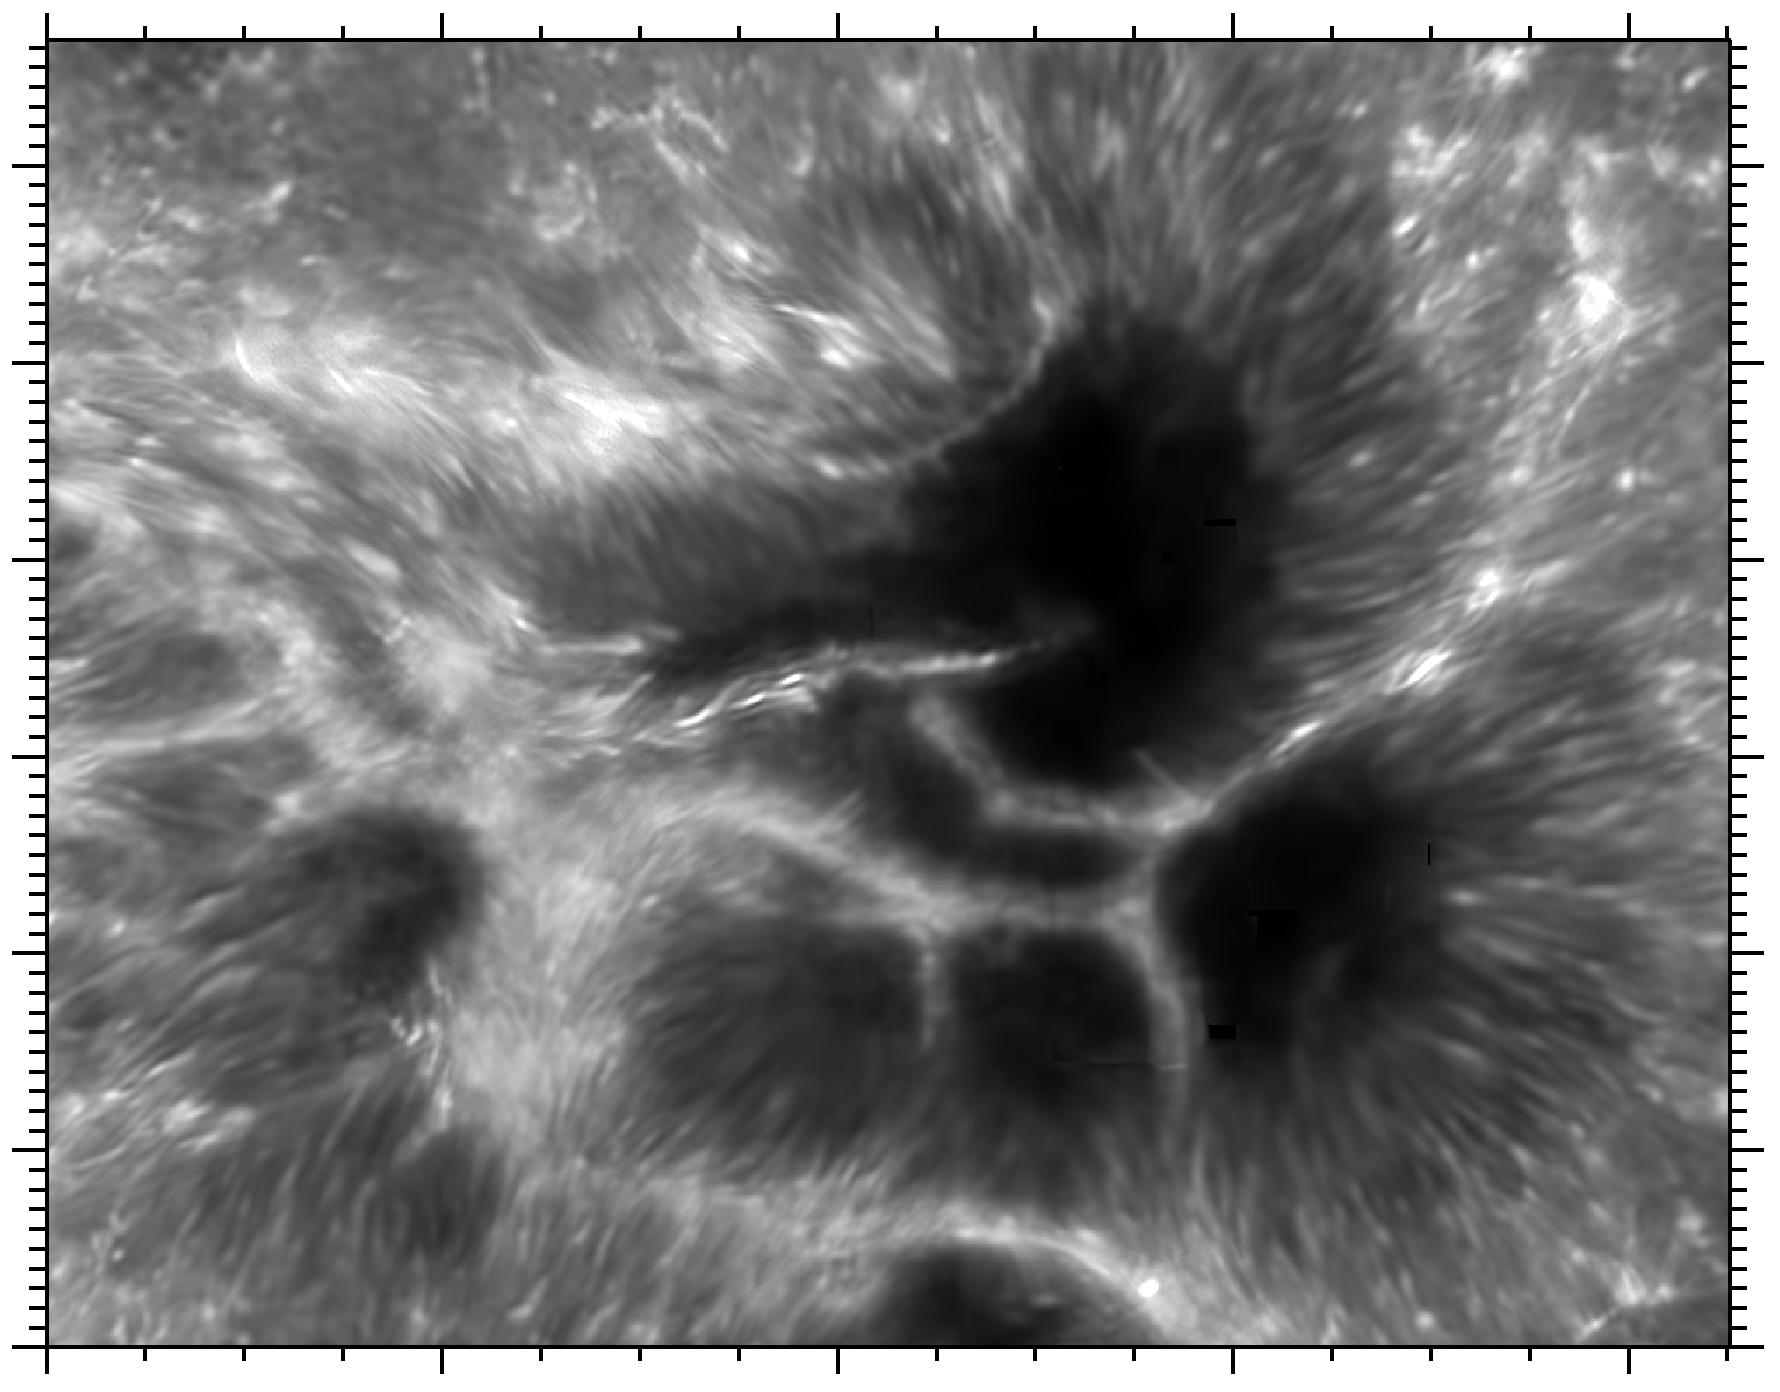
Images in the Ca II H line (left) and H-alpha (right) of active region AR10786 on July 8, 2005.

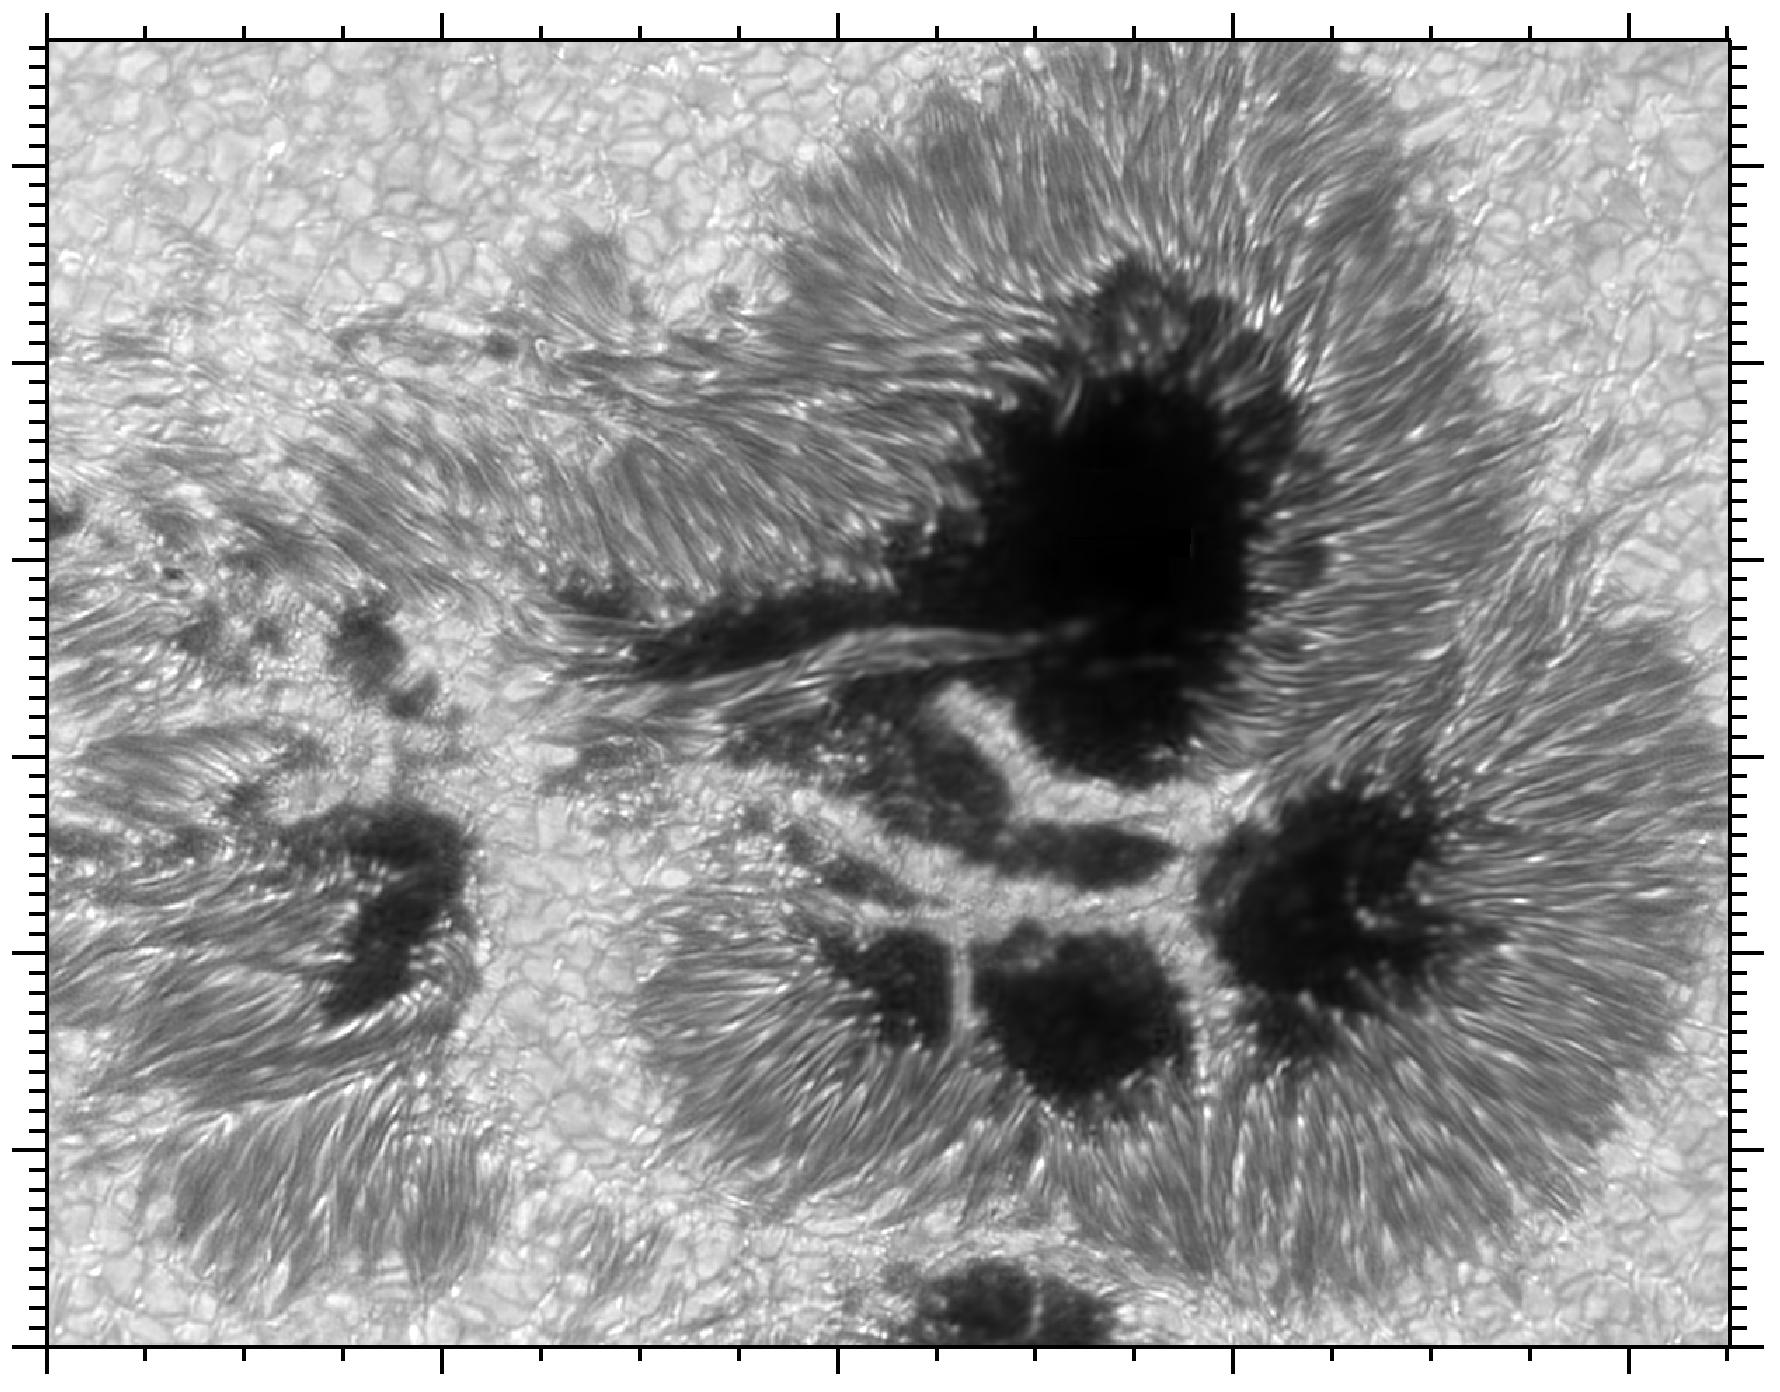
Images in the G band (left) and H-alpha (right) of active region AR10786 on July 8, 2005.
2004
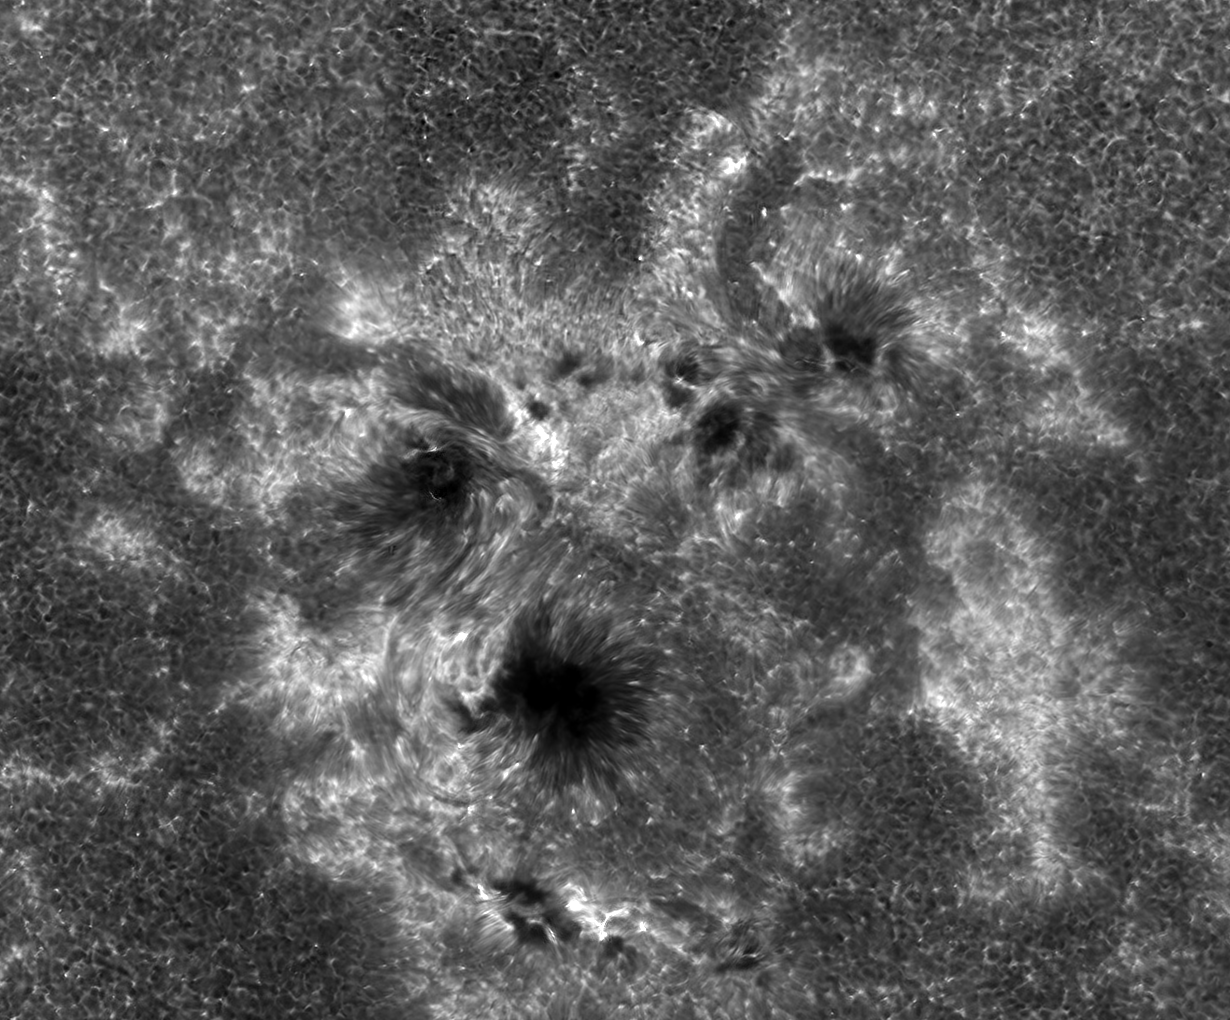
Images made of active region AR10675 on September 29, 2004 were featured on Astronomy Picture of the Day by NASA:

Sunspots — magnets the size of the Earth — are normally seen flat on the Sun. The above digital metamorphosis, however, shows a sunspot as it appears at increasing heights, effectively in three dimensions. The above false-colored image sequence of solar active region AR 10675 was taken in three very specific colors that effectively isolate different layers above the solar surface. The first images show the Sun’s photospheric surface as it normally appears, covered with granules. The large dark sunspot sports a clear dark umbra in the center surrounded by a lighter penumbra. Images appearing toward the middle of the sequence show the Sun as in light predominantly emitted a few hundred kilometers above the photosphere. At this height, the continent sized bubbling granules appear reversed, and long lines of constant magnetic force begin to appear. The last images show the Sun at a few thousand kilometers into the chromosphere. Here magnetic field lines can be clearly followed outward from the sunspot to distant regions.
Images in the G band (left) and the Ca II H line (right) of active region AR10675 on September 29, 2004.

Images in the Ca II H line (left) and H-alpha (right) of active region AR10675 on September 29, 2004.

Images in the G band (left) and H-alpha (right) of active region AR10675 on September 29, 2004.
2003
AR10486 photographed on November 2, 2003. Left: G-band image sampling the photosphere. Right: image in the Ca II H line of once-ionized calcium, sampling the chromosphere. The solar magnetic fields become more important in the chromosphere, and become brighter due to magnetic heating processes. This is also evident in the areas around the sunspots and the “hedges” of brightness towards the solar limb.

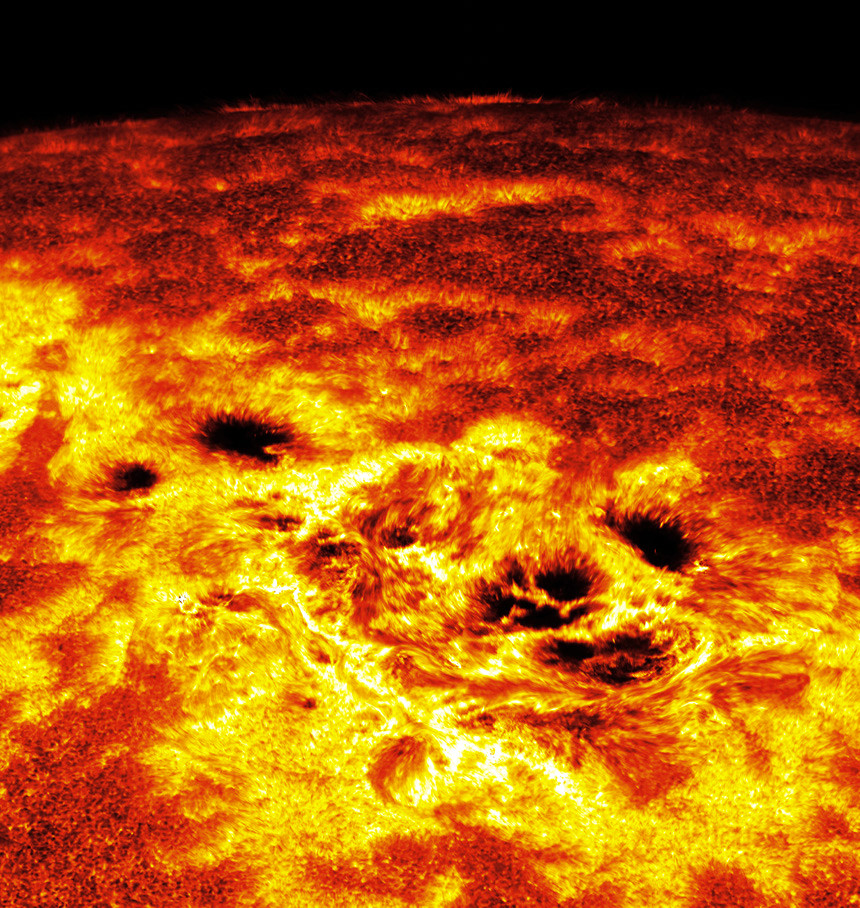
Image mosaics of active region AR10375 taken on June 6, 2003, respectively in the photospheric G band (left) and the chromospheric Ca II H line (right). The field measures 250×220 arcsec (1 arcsec is about 725 km on the sun). There are substantial changes in magnetic field topology between photosphere and chromosphere in all parts of this active region. For example, the light bridge across the umbra has very different lower endpoint structure in the photosphere and chromosphere.


Taken on May 1, 2003. Quiet solar area in the G band (left) and in Ca II H (right). The photosphere sampled by the G band shows bright granules, dark intergranular lanes, and tiny very bright magnetic elements. The granulation is the surface manifestation of solar convection. Granules are upwellings of hotter gas of which the rising motion gets stopped through the departure of the electromagnetic radiation that we observe as sunshine. The dark lanes are the places where the cooled gas sinks back. In these lanes bright points mark the presence of magnetic elements. They are relatively empty because the magnetic pressure pushes the gas out. One therefore views deeper into these elements, and observes the hot gas below the granulation surface. The Ca II H image at right samples the low chromosphere, about 400 km higher up. It is brighter where clusters of magnetic elements occur. These patches of enhanced brightness outline the chromospheric network, which coincides with the magnetic network constituted by the magnetic elements in the photosphere. The granulation pattern is partially reversed in the low chromosphere: at this height the gas above the lanes tends to be brighter than the gas above the granules.


Images in the G band (left) and the Ca II H line (right) of a mature, complex sunspot taken on May 1, 2003.